Pivot Tables are great for separating data into "bins" for a date column (by month, quarter, etc.).
For non-date data as in Variant Price you need to add a column to your data column that calculates the bin for each line of data. Then organize the Pivot Table around that added column.
Here's a simple example:
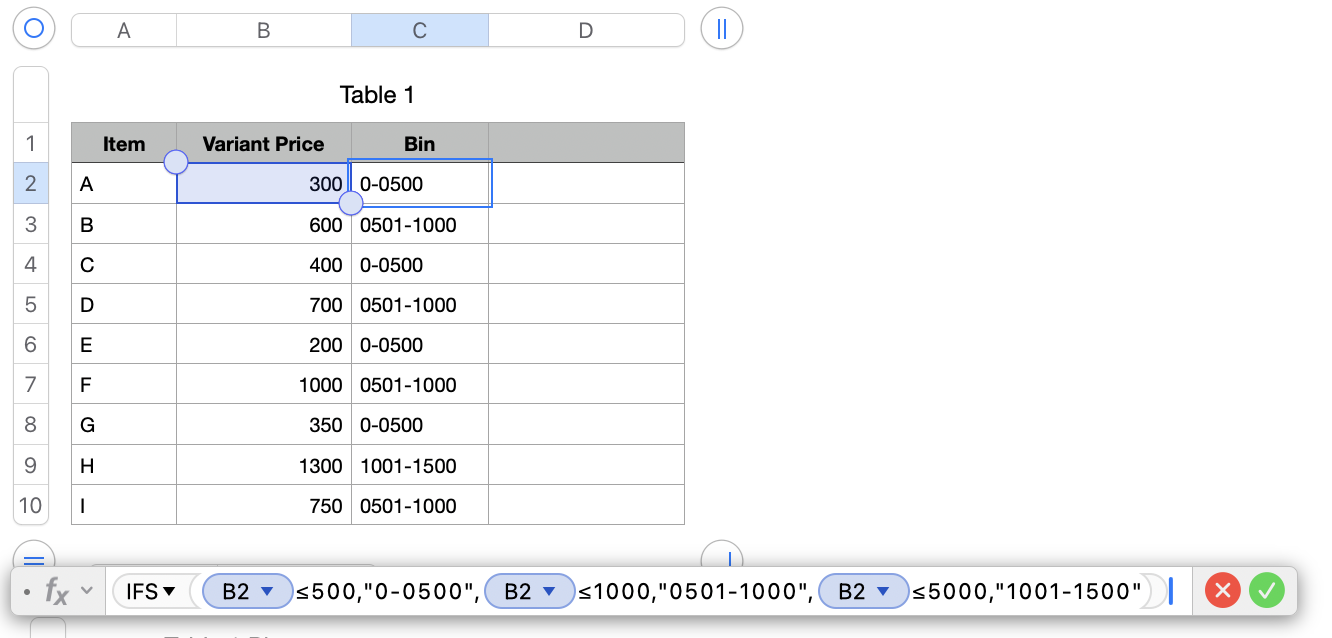
The formula in C2 of the example is:
=IFS(B2≤500,"0-0500",B2≤1000,"0501-1000",B2≤5000,"1001-1500")
Extend that formula with additional ifs-expression, ifs-true pairs to match the number of bins you need.
I "padded" with leading 0s in the formula so that the bins would sort in the desired order in the Pivot Table.
To create the Pivot Table I clicked in the data table and chose Organize > Create Pivot Table > On Current Sheet from the menu, and dragged the fields in the Pivot Options pane that appeared at the right.
The Pivot Options look like this:
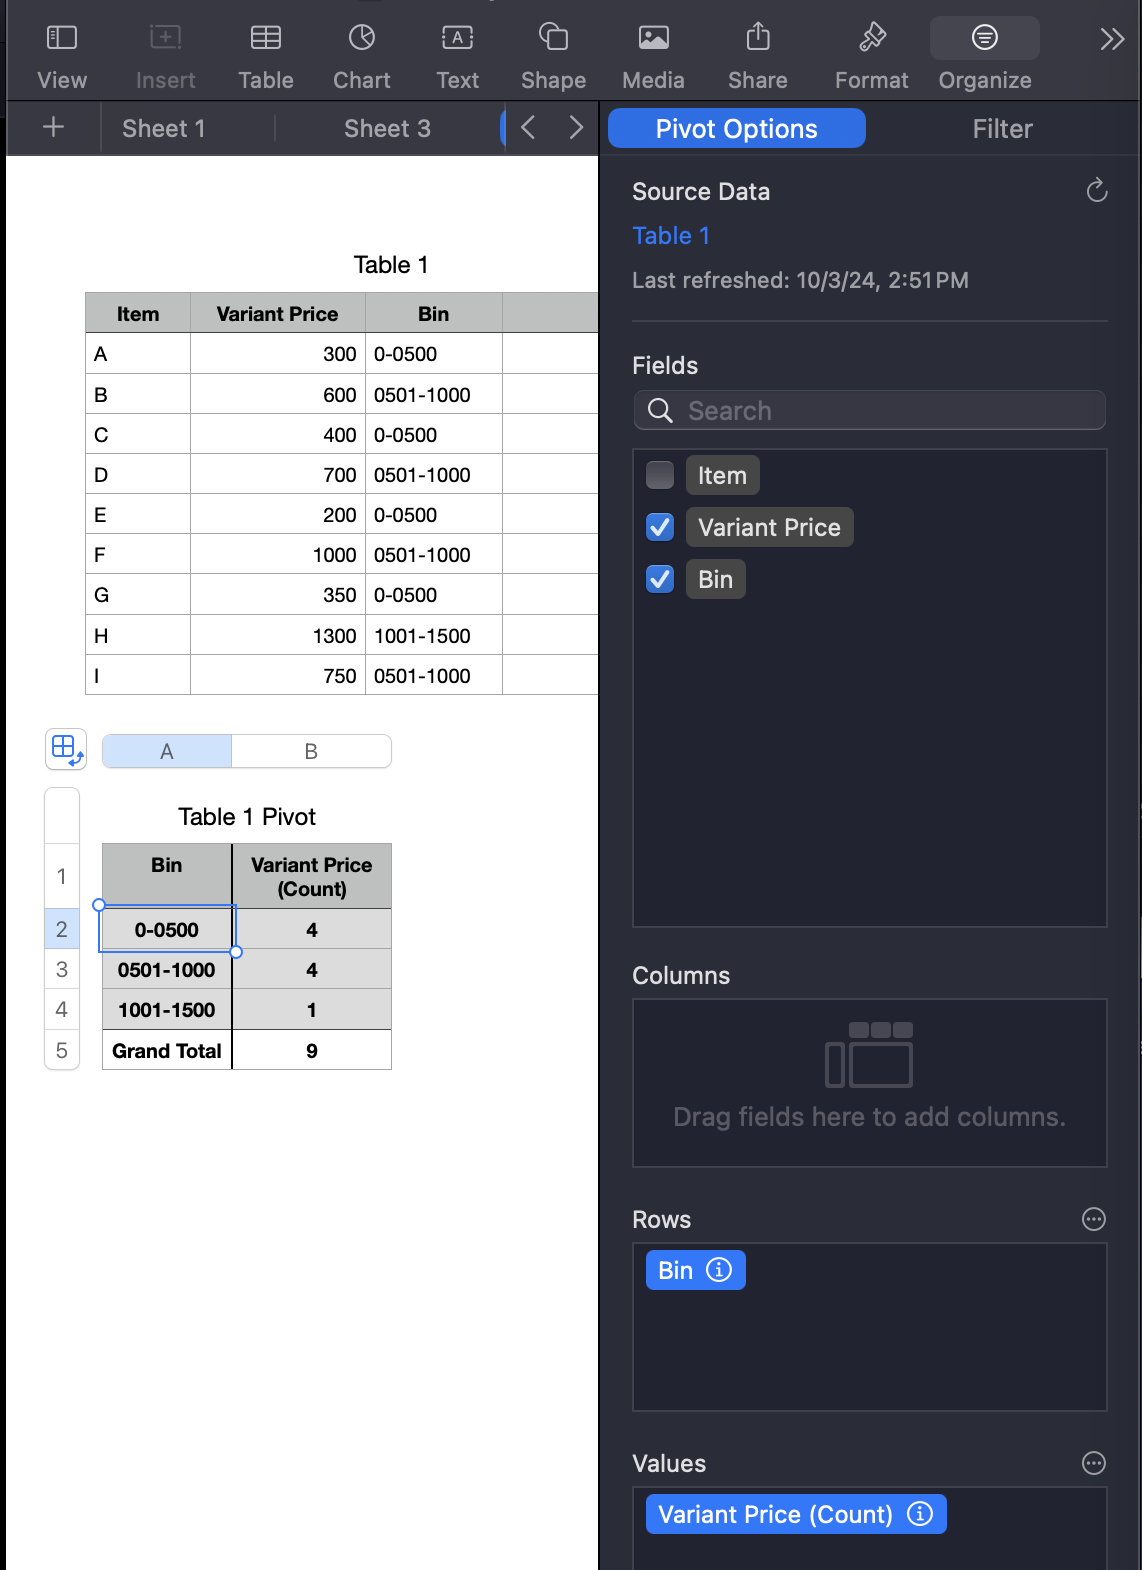
I clicked the circled i by Variant Price in the Rows box and chose Count instead of Sum.
Create a pivot table in Numbers on Mac - Apple Support
SG