Hi,
Adding a new row in the second chart is complicated and not really needed.
Here my proposal.
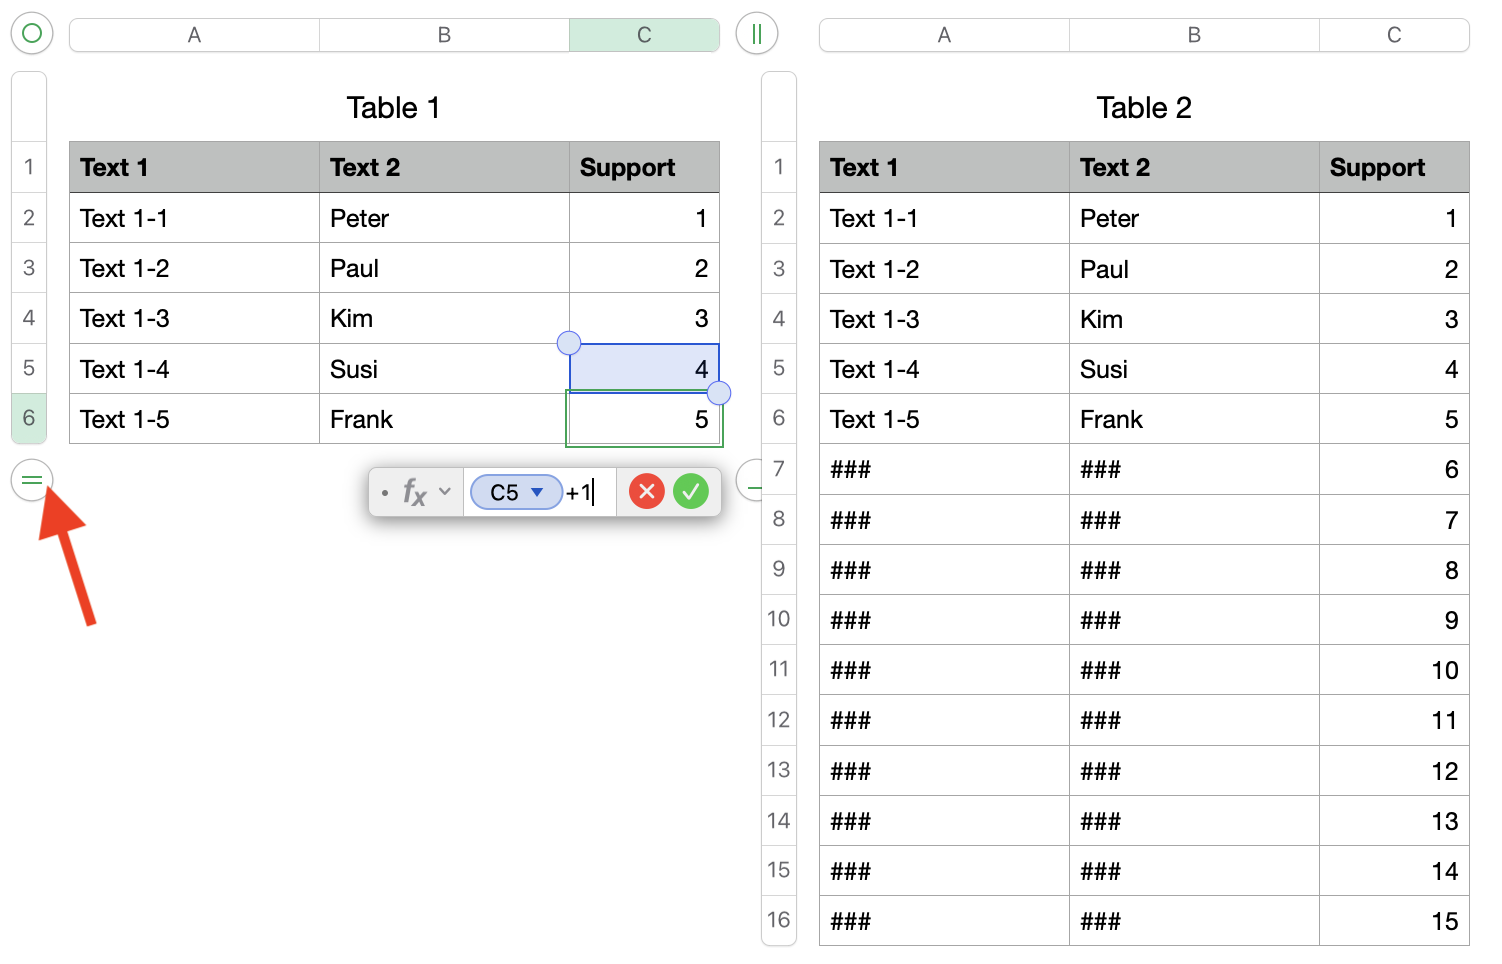
In Table 1 you will enter the data and add new rows if needed.
It has an additional column "Support", just a counter that will be increased by this formula.
As soon as you add a new row the last number will increase.
In Table 2 you use the XLOOKUP function
It will look for the value from Table 2 C2, it is searching in Table 1 column C, as soon as it will find it it will return the value from column Text 1 if not it will return ###
You can use ### or anything that will never be part of your inputs in Table 1!
Table 2 should have more rows than you may need, it can have hundred or a few thousand rows.
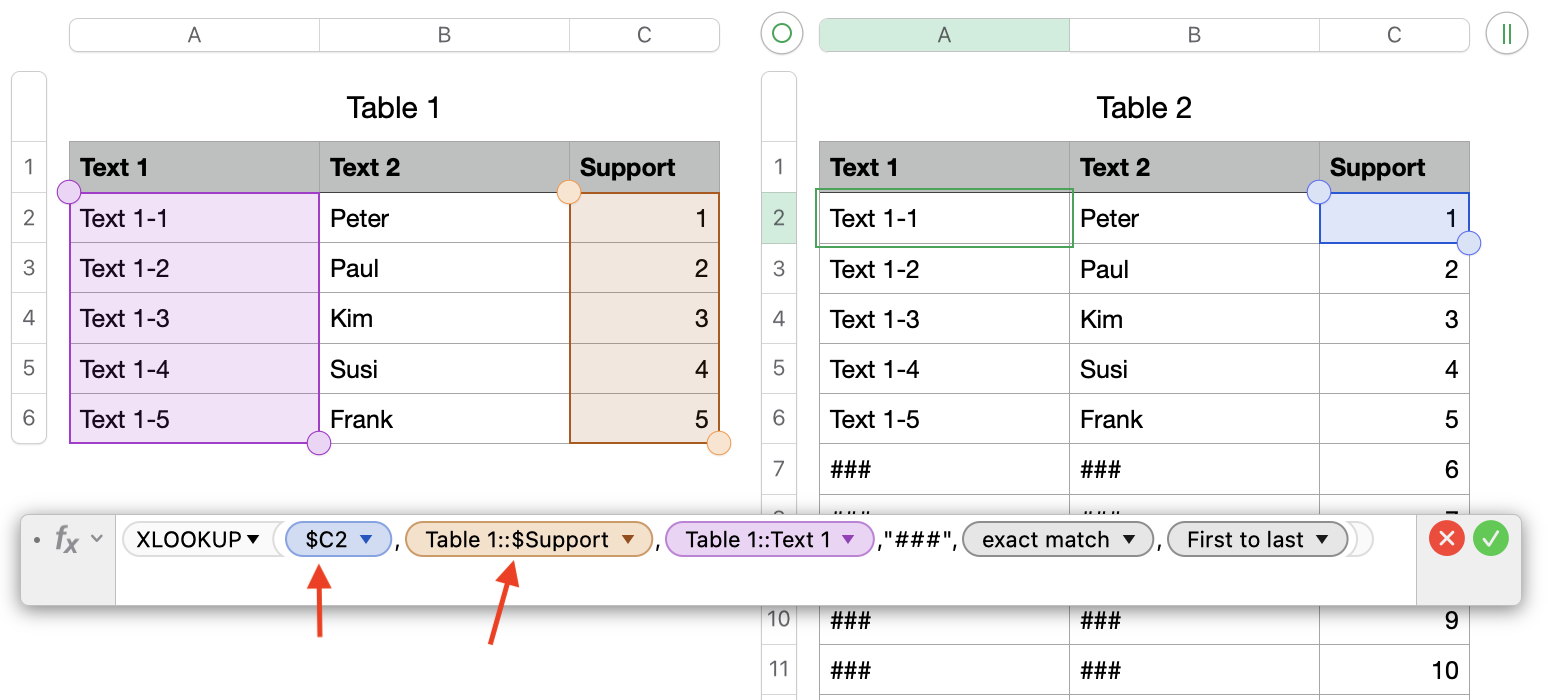
You must use $ to fixate the two columns !, this will help when you move the formula to the other columns.
Now you define a filter for Table 2 Text 1.
This filter will only show rows if the text in Text 1 is not ###, therefore it is important that you pick something that will never be in your inputs!
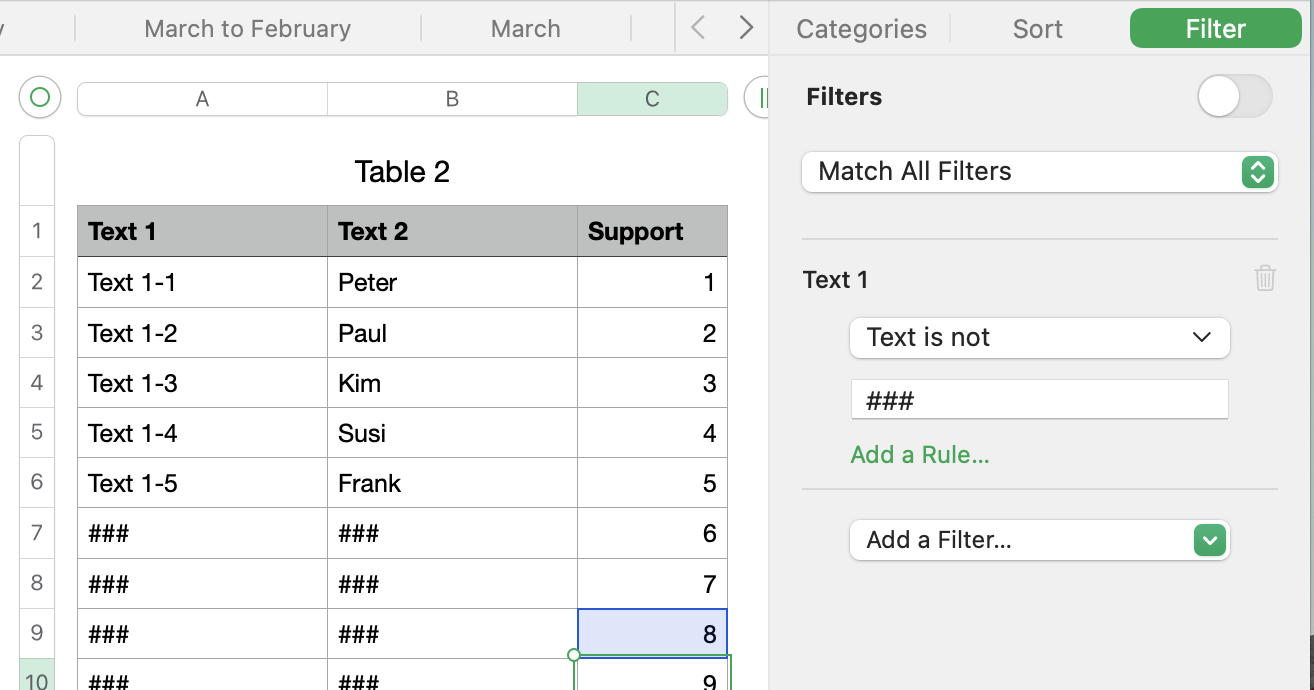
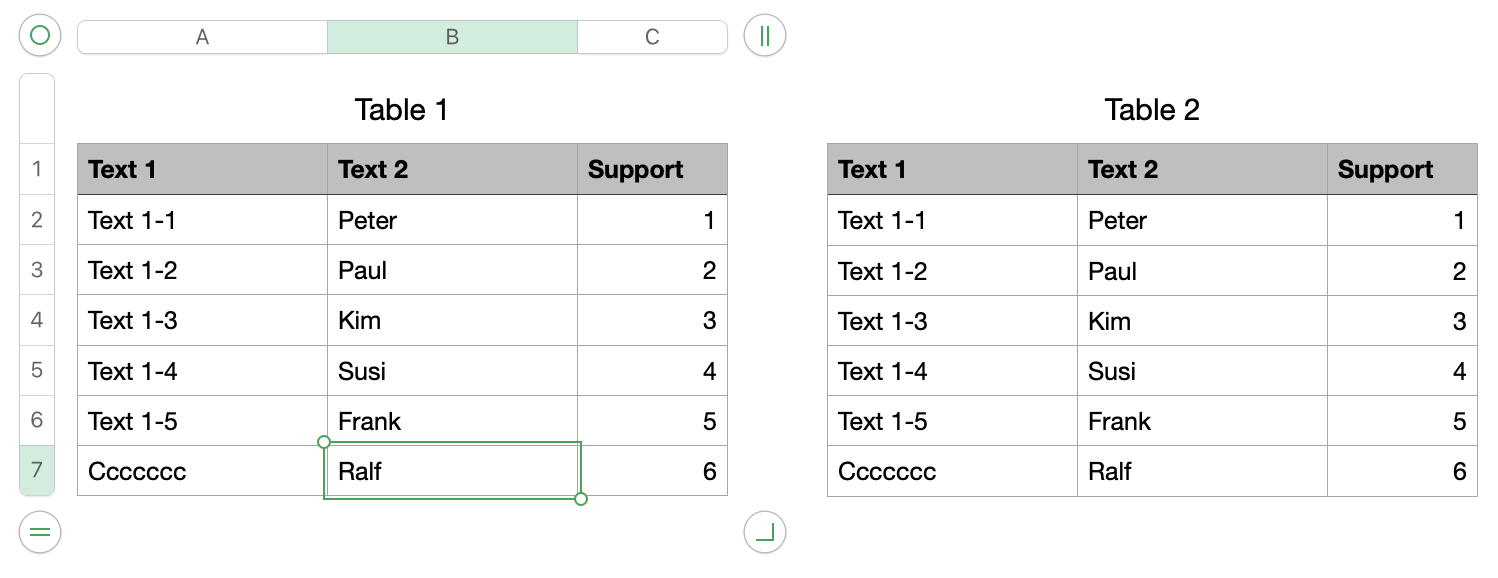
As soon as you add a new row in Table 1 you will also have a new visible row in Table 2.
Hope that will help you, let me know if you need additional support
If you don't like the column Support you can hide it, you can also pick a different location for it ;-)
Ralf