You can make a difference in the Apple Support Community!

When you sign up with your Apple Account, you can provide valuable feedback to other community members by upvoting helpful replies and User Tips.

Looks like no one’s replied in a while. To start the conversation again, simply ask a new question.

Chart Ranges not Extending when adding Rows to a Table

Hi,


I've been unable to ascertain why some charts update and some do not!


When I add a new row to a table that has columns used in a chart should the references in the chart automatically extend to include the new row(s).


I've examples where it does, and example where it doesn't but I've been unable to find any constant that would allow me to fix the problem.


Any guidance appreciated.


Regards

Mac Studio

Posted on Jun 3, 2022 12:54 AM

Reply
Question marked as Top-ranking reply

Posted on Jun 3, 2022 11:59 AM

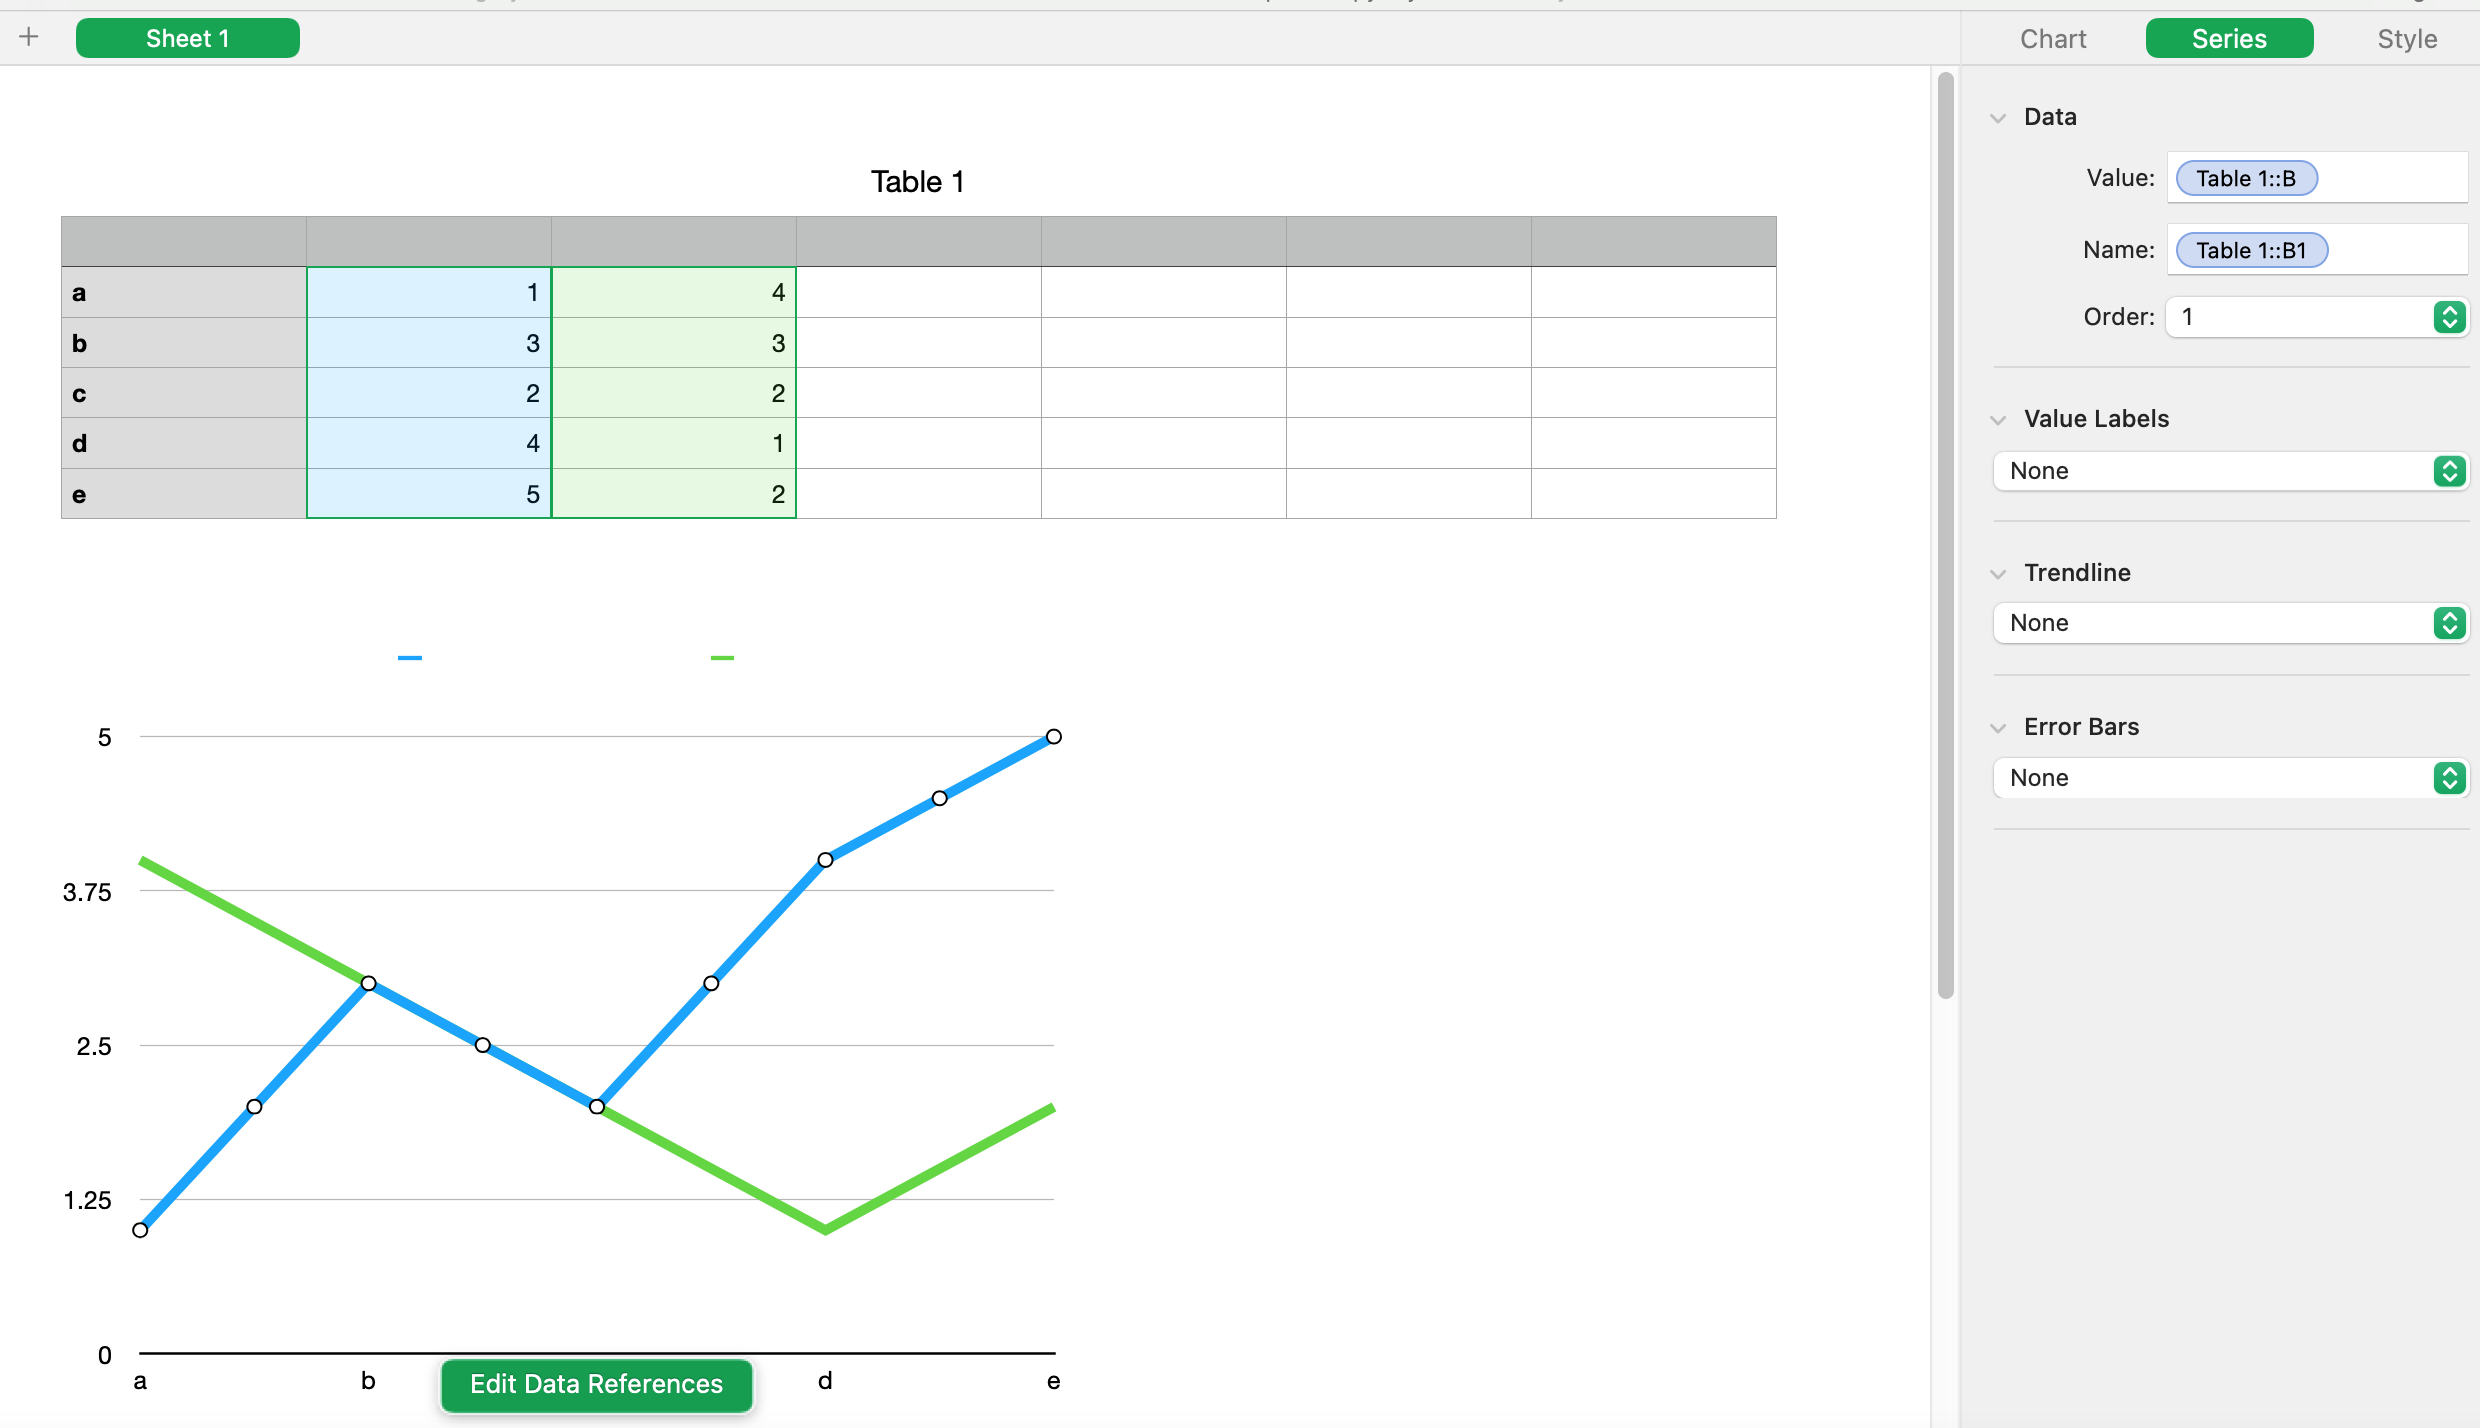
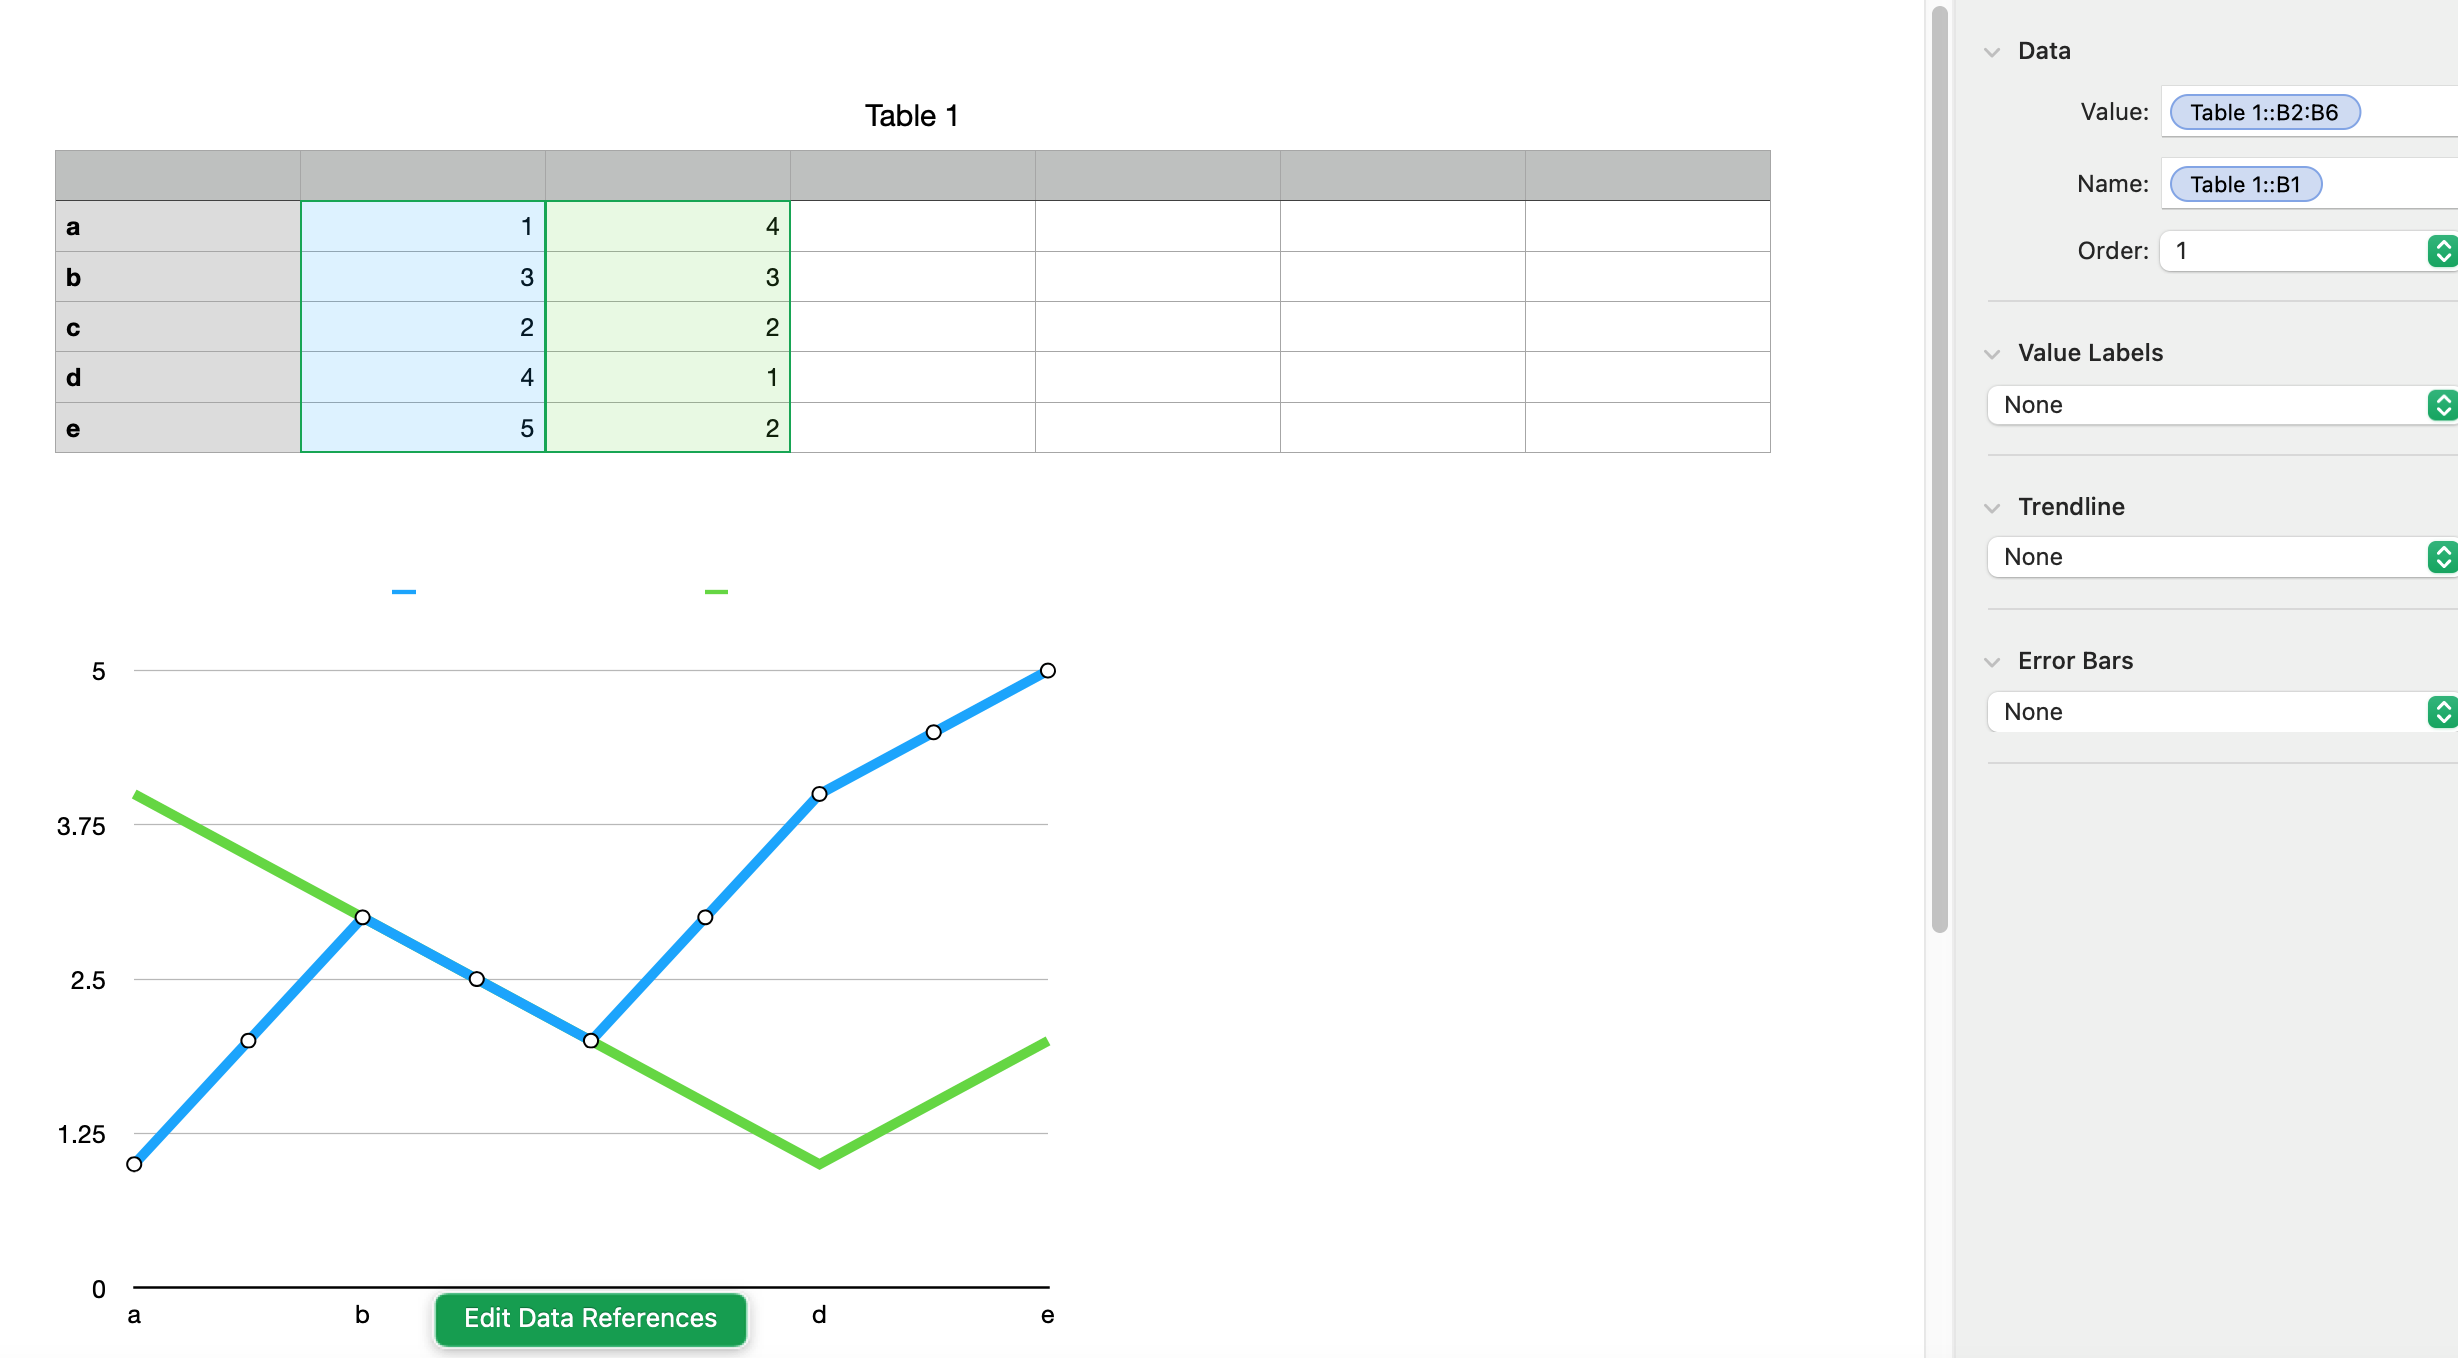
If you make a chart that uses every row of the table, it should make a reference to each series as the entire column, like Table 1::B as seen in the first screenshot below. When the reference is like that, it will (should) automatically include new rows of data. But if the reference is of the form Table 1::B2:B6 like in the second screenshot, it will not automatically include new rows added to the bottom. If your value references look like the second screenshot, you can change them. Click on the chart, click Edit Data References, go to your table, click on one of the colored circles indicating one of the series, click "Select all Body Cells in Column". I believe it will correct all the series, not just the one you clicked on. Of course, only do this if your chart is actually using or supposed to be using all the body cells in the table.


Ralf-F has found a bug about the order in which you enter data. If you find you are having that problem, click on the chart, click on the Axis tab, go to the X axis sub-tab, click somewhere inside the "Label References" box then hit Return without making any changes. The reference is there like it should be but it did not paint the chart with it.

Similar questions

6 replies
Question marked as Top-ranking reply

Jun 3, 2022 11:59 AM in response to iwaddo

If you make a chart that uses every row of the table, it should make a reference to each series as the entire column, like Table 1::B as seen in the first screenshot below. When the reference is like that, it will (should) automatically include new rows of data. But if the reference is of the form Table 1::B2:B6 like in the second screenshot, it will not automatically include new rows added to the bottom. If your value references look like the second screenshot, you can change them. Click on the chart, click Edit Data References, go to your table, click on one of the colored circles indicating one of the series, click "Select all Body Cells in Column". I believe it will correct all the series, not just the one you clicked on. Of course, only do this if your chart is actually using or supposed to be using all the body cells in the table.


Ralf-F has found a bug about the order in which you enter data. If you find you are having that problem, click on the chart, click on the Axis tab, go to the X axis sub-tab, click somewhere inside the "Label References" box then hit Return without making any changes. The reference is there like it should be but it did not paint the chart with it.


Jun 3, 2022 3:30 AM in response to SGIII

Here what I learned the hard way

Simple chart like this

Now I add a new row

First I add the text for X-Axis and then the value. It is working :-)


But if I add first the value and then the text for X-Axis I get something like this :-(


Has soon as I add an additional row, the chart will update

Then I use command Z and the last empty row is gone and everything looks good.


Ralf

Jun 3, 2022 2:12 AM in response to iwaddo

iwaddo wrote:

I've examples where it does, and example where it doesn't


Would you be willing to share those examples via screenshot? shift-command-4, drag crosshairs to select the area, release, start new post here, and insert the saved screenshot from the Desktop using the 'mountains-and-moon' Image Insertion' icon at the bottom of the compose window?


SG

Jun 3, 2022 2:18 PM in response to Badunit

Badunit and Ralf-F, Thank you. I've checked through all my charts and you are quite correct, the Value was in some cases set to a range of rows and not the whole column.


I do now know why some were correct and some were not but hopefully I've corrected the problem now.


The strange thing is that I had always created the charts by clicking on the column header and not by selecting the rows. Perhaps there is something I've done which has upset things.


Hopefully, I am ok for now. Thank you for your help

Chart Ranges not Extending when adding Rows to a Table

Welcome to Apple Support Community
A forum where Apple customers help each other with their products. Get started with your Apple Account.